 www.geodatenkatalog.de (S2L)
Keyword
Natural risk zones
112 record(s)
Provided by
Type of resources
Available actions
Topics
Keywords
Contact for the resource
Update frequencies
Service types
-
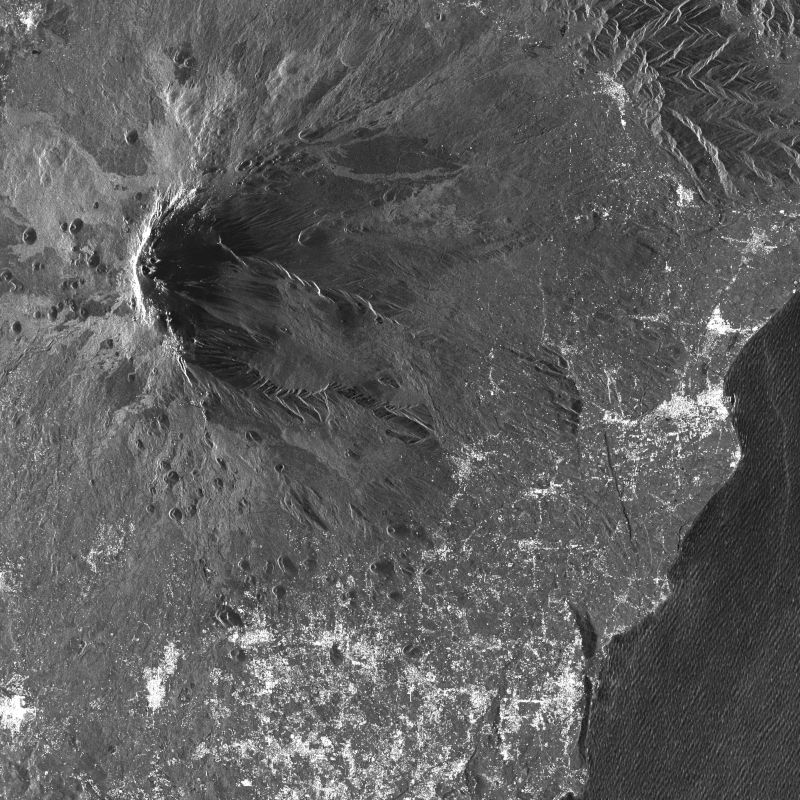
This collection contains TerraSAR-X Level 1b data acquired over the pre-defined Geohazard Supersites and a number of CEOS projects regions. The collection comprises mainly complex (SSC) with a number of detected (MGD) products. TerraSAR-X data can be ordered by a Principal Investigator (PI) of a respective Supersite region under the terms of a TerraSAR-X Science proposal accepted by DLR. Data is available for download by the Geohazard scientific community under the terms of the user license. Supersites are single sites or extended areas of high priority to the Geohazards community in which active single or multiple geological hazards pose a threat to human population and/or critical facilities. The Supersites initiative provides access to spaceborne and in-situ geophysical data of selected sites prone to earthquake, volcano or other hazards. For further information see: http://ceos.org/ourwork/workinggroups/disasters/gsnl/ Overview of permament Supersites: http://geo-gsnl.org/supersites/permanent-supersites/
-

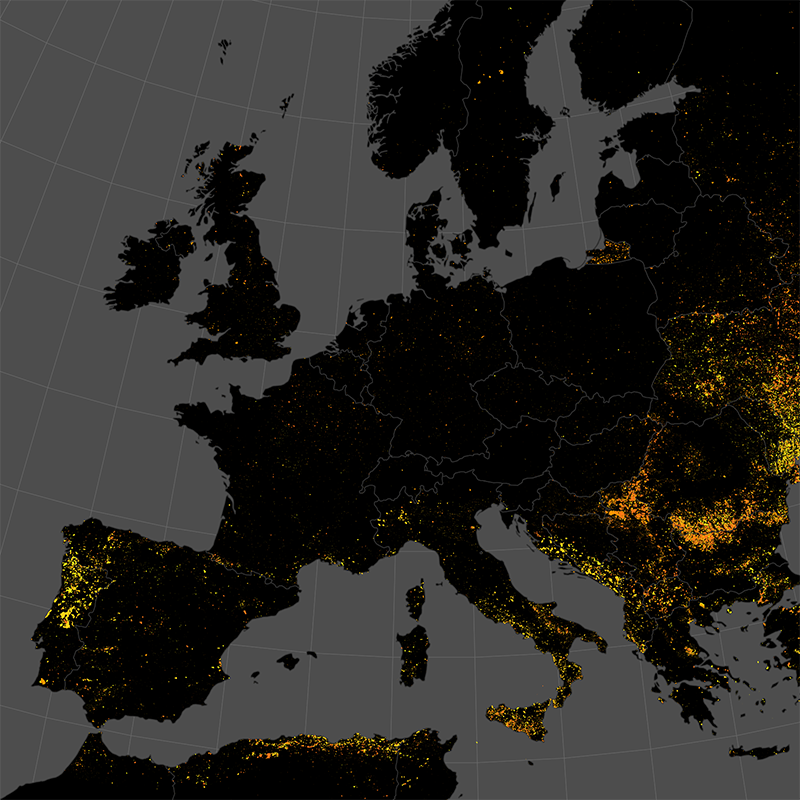
The product is automatically derived from Sentinel-3 (OLCI) satellite imagery in near-real time. It is an incremental product, meaning that the retrieved results are updated as soon as new input data becomes available over a timespan of ten days. Besides the fire perimeter, and detection time each feature contains information about the severity of the burning.
-

This data set represents the monthly, accumulated results of the final (10-day) version of the fire perimeters from the "Burnt Area Daily NRT Incremental Product - Europe, Sentinel-3" dataset. The burn perimeters are spatially and temporally correlated, so that interrelated detections from consecutive observations are combined into a single feature. A perimeter is interpreted as belonging to a given event if a spatial overlap exists within a time frame of 15 days. Besides the geometry, attribute information is also combined while considering the size of the perimeter as a weighting factor. Each feature contains information about the final fire perimeter, Date/Time of the first detection, and the averaged burn severity.
-
The product is automatically derived from Aqua/Terra (MODIS) satellite imagery in near-real time. It is an incremental product, meaning that the retrieved results are updated as soon as new input data becomes available over a timespan of ten days. Besides the fire perimeter and detection time, each feature contains information about the severity of the burning.
-

This data set represents the yearly, accumulated results of the final (10-day) version of the fire perimeters from the "Burnt Area Daily NRT Incremental Product - Europe, Sentinel-3" dataset. The burn perimeters are spatially and temporally correlated, so that interrelated detections from consecutive observations are combined into a single feature. A perimeter is interpreted as belonging to a given event if a spatial overlap exists within a time frame of 15 days. Besides the geometry, attribute information is also combined while considering the size of the perimeter as a weighting factor. Each feature contains information about the final fire perimeter, Date/Time of the first detection, and the averaged burn severity
-

The WMS GRSN (INSPIRE) represents the seismological stations of the German Regional Seismic Network (GRSN) equipped with 3-component broadband seismometer and digital data aquisition system. The recorded data are directly transmitted to the data center at BGR in Hannover and made available to the public near realtime. According to the Data Specification on Geology (D2.8.II.4_v3.0, subtopic Geophysics) the information with respect to the seismological stations is INSPIRE-compliant. The WMS GRSN (INSPIRE) contains a layer of the seismological stations (GE.seismologicalStation) displayed correspondingly to the INSPIRE portrayal rules. Via the getFeatureInfo request the user obtains the content of the INSPIRE attributes platformType, relatedNetwork, stationType und stationRank.
-
Elbe - potentiell überschwemmte Flächen, Modell 2017: Szenarien: Szenario HQ20 (3130 m³/s), Überflutungsfläche Szenario HQ50 (3820 m³/s), Überflutungsfläche Szenario HQ100 (4374 m³/s), Überflutungsfläche Szenario HQ200 (4930 m³/s), Überflutungsfläche Szenario HQ500 (5710 m³/s), Überflutungsfläche Szenario 4,00 m + PN Pegel Dresden (727 m³/s), Überflutungsfläche Szenario 4,50 m + PN Pegel Dresden (1025 m³/s), Überflutungsfläche Szenario 5,00 m + PN Pegel Dresden (1193 m³/s), Überflutungsfläche Szenario 5,50 m + PN Pegel Dresden (1374 m³/s), Überflutungsfläche Szenario 6,00 m + PN Pegel Dresden (1611 m³/s), Überflutungsfläche Szenario 6,50 m + PN Pegel Dresden (1895 m³/s), Überflutungsfläche Szenario 7,00 m + PN Pegel Dresden (2222 m³/s), Überflutungsfläche Szenario 7,50 m + PN Pegel Dresden (2597 m³/s), Überflutungsfläche Szenario 8,00 m + PN Pegel Dresden (3027 m³/s), Überflutungsfläche Szenario 8,50 m + PN Pegel Dresden (3519 m³/s), Überflutungsfläche Szenario 9,00 m + PN Pegel Dresden (4079 m³/s), Überflutungsfläche Szenario 9,50 m + PN Pegel Dresden (4715 m³/s), Überflutungsfläche Szenario 10,00 m + PN Pegel Dresden (5437 m³/s), Überflutungsfläche Szenario 10,50 m + PN Pegel Dresden (6255 m³/s), Überflutungsfläche
-
1845 - Scheitel: 31.03.1845, Durchfluss ca. 5.700 m³/s, Wasserstand von 8,77 m am Pegel Dresden Quelle: Die Darstellungen wurden nach GIS-technischer Auswertung historischer Kartenwerke durch das Institut für ökologische Raumentwicklung i. A. des Umweltamtes im Januar 2003 angefertigt und stehen nur als georeferenzierte Vektordaten zur Verfügung.
-
Dargestellt sind die minimalen Flurabstände des Grundwassers in Meter unter Gelände bei und nach dem Hochwasser vom Juni 2013 als synoptische Darstellung. Eingeflossen sind Daten bis zum 23.07.2013. Die Flurabstände wurden dabei durch Verschnitt der interpolierten Grundwasseroberfläche mit dem Geländemodell (DGM) ermittelt.
-
Elbe - 750 cm Pegel Dresden (HQ10), potentiell überschwemmte Flächen